
Do you think your storage solution/disk is holding you back?
Hard Disk Drives (HDD’s) and Solid State Disks (SSD’s) issue commands in a similar way at the hardware level. Command queuing is an essential indicator when diagnosing a performance problem on all systems.
Here are two fast ways to view and diagnose disk queue length with build-in tools for Windows and Linux:
Windows:
In Windows, the “Resource Monitor” is your friend. You can find it in the Start menu, or as a link in the performance tab of Task Manager.
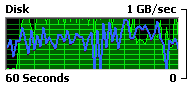
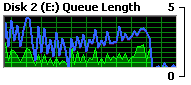
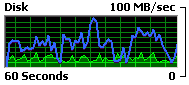
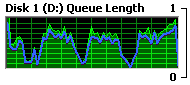
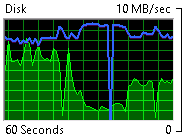
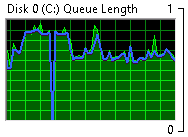
During large or small reads or writes queue length will indicate if the disk is overrun with IO commands. A queue length under 1 tells us that the disk is receiving and delivering IO operations in a timely manner. Any queue length over 1.0 would start indicating that the disk is overrun with IO operations, and the system is waiting on it.
See three examples here of no congestion during different IO scenarios. None of these examples indicate a disk performance issue.
Even at slower speeds, queue length still indicates that a disk is at or near 100% utilization.
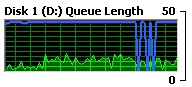
You know there’s trouble when the Queue Length scale jumps to 50 in Windows. With a queue length over 1 indicating an issue, when the queue length jumps to over 10 there is a serious disk congestion issue.

Linux:
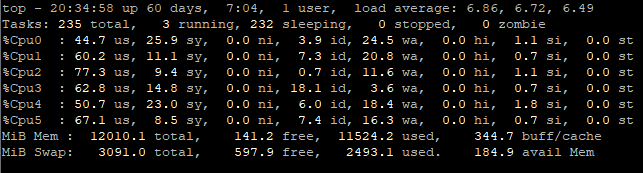
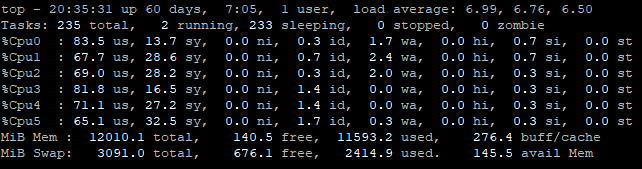
Running the “top” command presents the normal view, an easy way to diagnose disk congestion during operation is to watch the “iowait” percentage for each CPU (or ‘wa’). By default “top” shows the CPU package, by pressing ‘1’ you can view all logical CPU cores and observe if there is high iowait for sustained periods (more than 1-2 seconds). IOWAIT can drag performance to a halt if all the system is doing is waiting on disk IO.
Recent Comments